

A field guide to the platforms, data sources, and tools shaping a market moving toward $1 trillion by 2030.
Quick question: the last time you wanted to know what the market actually thought about something, a Fed decision, an election, whether a company hits its next earnings number, how many tabs did you open to find out? If the honest answer is three or four, you’re not being inefficient. You’re using the tools correctly. There just isn’t one obvious place that shows you all of it at once, and closing that gap has quietly become one of the more interesting product problems in fintech right now.
That gap exists because the underlying market got big fast. A category that was doing under $5 billion a month as recently as September 2025 was doing roughly $24 billion a month by April 2026, according to data compiled by TRM Labs. CoinMarketCap separately clocked $25.7 billion in March 2026 trading volume across the category, up more than 1,100% year over year. Bernstein analyst Gautam Chhugani has gone further, [projecting the industry toward a $1 trillion market by 2030. That is the kind of number that pulls in exchange operators and regulated brokerages, not just retail traders chasing a hunch, and it is why CME, Cboe, Intercontinental Exchange, Interactive Brokers, and Robinhood are all already circling the category in one form or another.
Financial Tech Times has covered a related angle of this shift already, profiling how firms like VICO are pairing large language models with Bayesian forecasting frameworks to sharpen predictions on exactly these kinds of real-world questions. The forecasting side and the market side are converging on the same problem from two directions: one is trying to generate a better probability, the other is trying to observe the probability the crowd has already priced. Both only matter if you can actually see the number clearly, which is a harder problem than it sounds once more than one platform is involved.
Which Platforms Are Actually Worth Knowing?
Five platforms now account for most of the serious volume in this category, and they are not clones of each other.
Polymarket is the largest by liquidity and settles on-chain, on Polygon, with funds held in each trader’s own wallet rather than in a company account. Its current taker fee runs on a category-by-category rate, from 4% on politics and finance markets up to 7% on crypto markets, while geopolitical and world-event markets stay fee-free entirely.
Kalshi is the regulatory front-runner: a CFTC-designated exchange with cash held in FDIC-insured bank accounts and direct US retail access. It has also been taking the largest share of monthly category volume, roughly 74.5% in July 2026, even as Polymarket’s own valuation talks pushed past $20 billion.
Limitless runs on Base and structures its order book differently than the other four, with independent YES and NO books rather than one combined book, and lists some of the fastest-resolving markets in the category, a handful settling in as little as a minute.
Predict.Fun settles on Blast and is structurally closer to Kalshi and Polymarket’s central-limit-order-book model, running its own separate market catalog on its own chain.
Opinion pairs an order book with an AI-assisted optimistic resolution process, and its taker fee is dynamic rather than flat, smallest near the edges of a probability and highest right around a coin flip.
None of these five is simply a worse or better version of the others. Cash-backed and on-chain settlement solve different problems for different traders, and a platform’s fee curve, resolution process, and even how it defines “price” all travel with the number you see on screen. Two platforms can list what looks like the identical question and price it three or four points apart, not because one of them is wrong, but because the mechanics underneath a “price” simply are not the same thing from platform to platform.
What About the Data and Tools Around Them?
Knowing the platforms is one layer. Making sense of what they collectively show is a separate problem, and a small ecosystem of tools has grown up specifically to solve it.
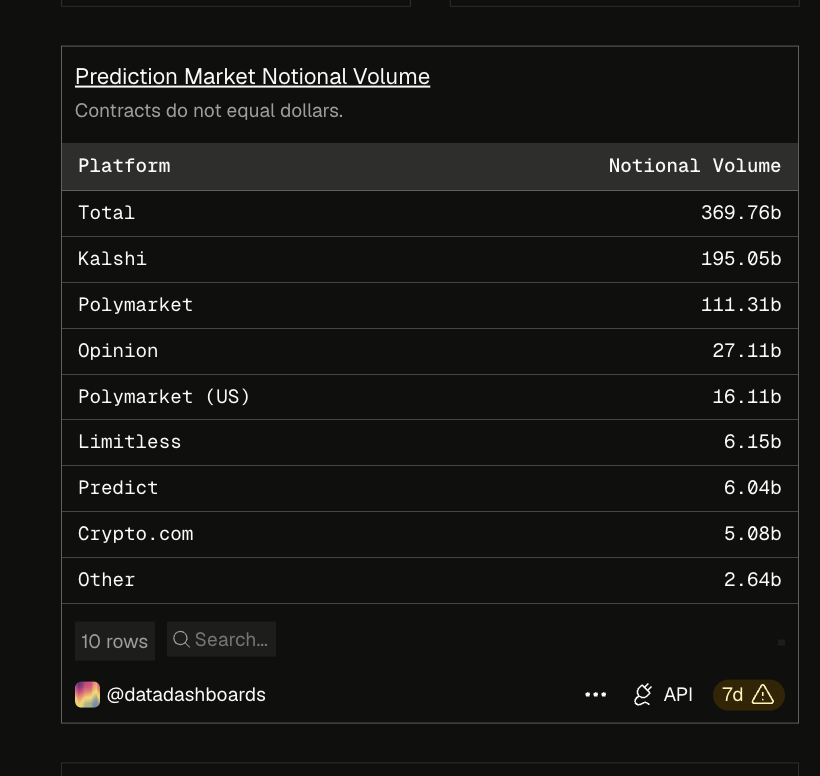
As seen above, Dune Analytics hosts a number of community-built dashboards tracking on-chain prediction market activity in real detail, useful for directional, industry-level reads, though they are community-maintained rather than official benchmarks, so exact figures are worth treating with the same caution as any self-reported crypto data.
Each platform’s own help center remains the primary source for its current fee schedule and resolution rules, which are the terms a trader is actually agreeing to. For anyone tracking the regulatory side specifically, the CFTC’s own public guidance is worth going to directly rather than relying on a secondhand summary of it.
One newer entry worth knowing in this same category is PredictionHero, a free dashboard built specifically to normalize odds across Polymarket, Kalshi, Limitless, Predict.Fun, and Opinion into one comparable view, something close to a CoinGecko for prediction markets. It does not execute trades or hold funds. Its job is narrower: take five platforms that each quote prices differently, some in cents, some in dollars, one with a variable fee already baked into the displayed number, and convert all of it into a single normalized read so a cross-platform comparison takes a glance instead of a manual unit conversion across five tabs.
Beyond the core odds feed, it also runs a broader category taxonomy for browsing markets that would not otherwise surface on any single platform’s own site, and indices across various subject categories, built on the same underlying cross-platform data.
The distinction between a trading platform and a tool like this is worth being precise about. A platform’s incentive is to get a trader to place a position there specifically. A neutral aggregator’s incentive is a cross-platform, apples-to-apples read on what the market collectively believes, regardless of where that belief happens to be priced most efficiently. That is a genuinely different job, and it is why journalists, researchers, and traders checking a probability tend to reach for a tool like this rather than any single platform’s own dashboard, which by design only shows its own book.
A concrete example of why that normalization work actually matters: Kalshi publishes its own taker fee as `0.07 × contracts × price × (1 − price)`. Run that formula against Polymarket’s crypto-category rate of 7% on the same shape of curve, and the two platforms now charge takers an identical fee at every price point, a convergence that would have sounded wrong a year ago, when Polymarket’s whole pitch leaned on having no trading fee at all. That is not the kind of comparison most traders find by reading two separate help center pages back to back. It is the kind of thing a cross-platform view surfaces automatically, once the two fee schedules sit inside the same normalized system.
Where Is This Actually Headed?
Look at who is writing checks and the direction gets easier to read. Regulated exchanges and mainstream brokerages are moving toward this category, not away from it, and a sell-side analyst has now put a trillion-dollar figure on where the whole space lands by the end of the decade. That is usually the point in a market’s life where the interesting question stops being “is this real” and starts being “who actually has a clear view across all of it.”
None of that requires picking a single winning platform, and it should not. The more durable pattern looks like what happened earlier in equities and crypto: individual venues compete on liquidity, product, and regulatory footing, while a separate layer of data and intelligence tools grows up around them to make sense of the whole picture at once. Prediction markets are far enough along now that the second layer is no longer optional. It is the difference between reading one exchange’s own numbers and actually knowing what the market thinks.


